- What is actually driving my business?
- Are elections impacting my engagement metrics?
- Why is revenue trending down this year?
Welcome to Augmented Analytics

- Autonomously investigates all KPIs daily
- Contextualizes external information
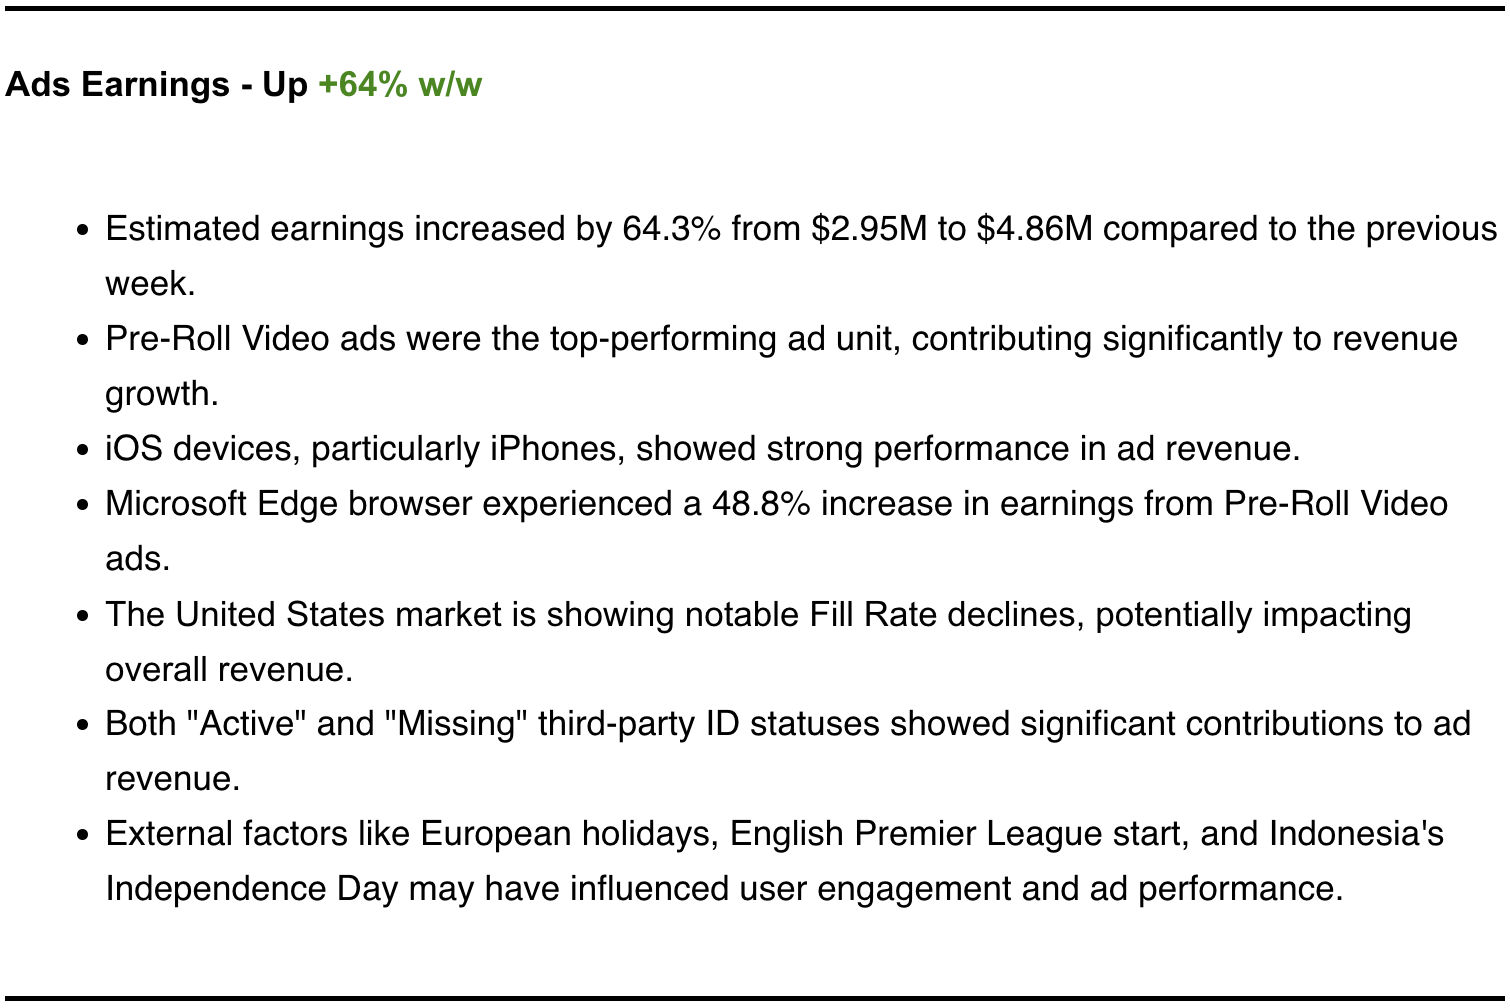
- Summarizes KPI changes in a few words
Accuracy of Our Numbers

DataScoop empowers Analysts
What our customers have to say
"My week begins in DataScoop. It informs me of important changes to my business, and improves my time spent on dashboards. It proactively uncovers trends and problems that would otherwise catch us off guard. My team looks forward to DataScoop narrative every Monday morning."
"DataScoop uses comprehensive data collection and analysis methodologies to effectively direct towards the root causes related to a business problem. The visualization towards isolating the problem to specific segments is well-structured and is powerful in drawing insights from metrics trends and doing targeted study. The tool also follows a thorough stakeholder involvement process and considers any user input relevant for analysis/insights. Overall, I would recommend DataScoop for business users tracking KPIs/business metrics trends on a regular basis."
"DataScoop diagnoses metric deviations comprehensively, going beyond traditional tools. It synthesizes external data (holidays, events, news) to contextualize metric shifts and presents complex insights as readable narratives. If analyzing a business metric is a 100-mile journey, this tool covers the first 50 miles effortlessly, allowing analysts to focus on deeper, strategic insights. Leveraging recent AI advancements, DataScoop represents the future of analytics."
Data Security

Pricing Plans
- Free Trial
- Unlimited CSV upload
- 5M rows and 3GB file size / upload
- 1 user seat
- 1 executive summary / week
- Unlimited data narratives
- Everything in Individual, plus
- 2 data connections
- 10 executive summaries / week
- 5 user seats
- Engineering Support for data prep
- Phone support
- Everything in Business, plus
- Deploy on-prem option
- Unlimited data connections
- Unlimited user seats
- SLA commitment
- Personalized + Priority service
Also available in:
